Campaign Lift Lab
Synthetic benchmark Synthetic data: Ledgerly
Marketing and lifecycle campaigns with a known true effect hidden in a truth file, measured the way a growth analytics team would, then scored on whether the analysis found the truth.
- Status
- Write-up ready, code not public yet
- Relevant to
- Data and analytics
Results · Synthetic data: Ledgerly
- Synthetic benchmarkSynthetic data: Ledgerly. Measured against a hidden answer key in that data. It shows the method works there, not a production result.primary intervals contain the true effect on seed 42Synthetic benchmark
- Synthetic benchmarkSynthetic data: Ledgerly. Measured against a hidden answer key in that data. It shows the method works there, not a production result.bias of a two-week launch readout, against −2% for the week 7–8 readoutSynthetic benchmark
- Synthetic benchmarkSynthetic data: Ledgerly. Measured against a hidden answer key in that data. It shows the method works there, not a production result.of runs found a false “winning segment” at p < 0.05. Holm correction: 4.5%Synthetic benchmark
At a glance
- Question
- Did a campaign actually cause more conversions, or does the dashboard only make it look that way?
- Data
- Simulated campaigns on Ledgerly rows (synthetic), each with a known true effect hidden in a truth file and a planted trap.
- Compared with
- A naive launch-window readout, and segment hunting with no multiple-testing correction.
- How it was tested
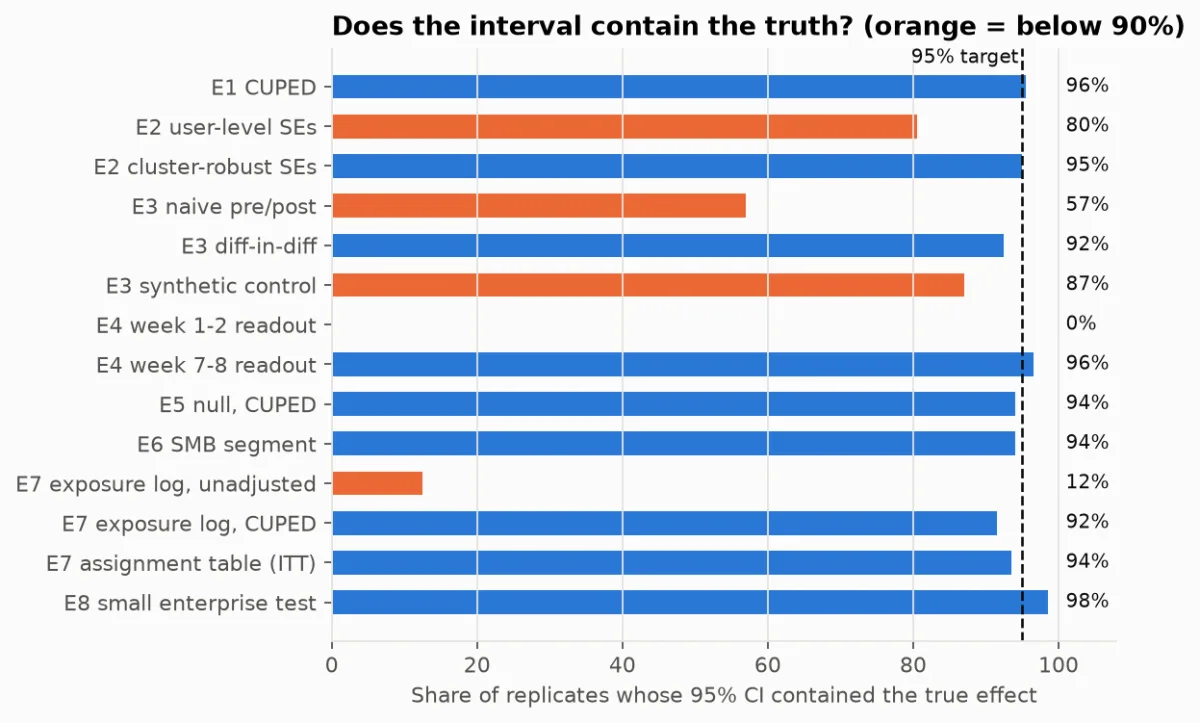
- CUPED, clustered errors, diff-in-diff and synthetic control, each scored against the hidden truth over 200 replicate portfolios.
- Result
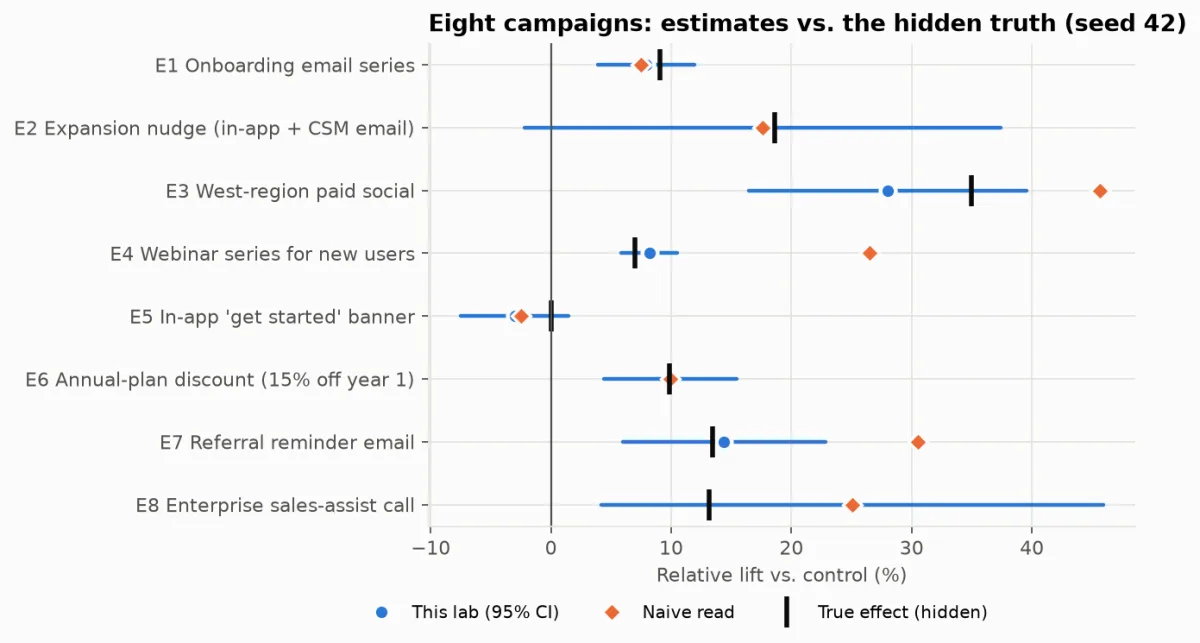
- All 8 primary intervals contained the true effect on seed 42. A two-week launch readout was biased by +269%, and uncorrected segment hunting found a false winner in 47% of runs (4.5% with Holm correction).
- What it doesn’t show
- The traps were designed alongside the analysis. Coverage that came back below 95% is reported as is.
The problem
Dashboards read launch-week spikes, exposure-log bugs and seasonality as campaign lift. A naive read can be confidently wrong.
What I built, in detail
- A seeded simulator that runs campaigns on real Ledgerly rows, each with a planted trap: novelty decay, clustering, sample-ratio mismatch, an effect in one segment only, a true null.
- Analysis with CUPED, account-clustered errors, geo diff-in-diff, synthetic control, segment effects with Holm and Benjamini-Hochberg corrections, and meta-analysis.
- A one-page decision memo per test (scale, kill or re-test) with the one caveat that would change the decision.
- A test that parses the analysis modules to make sure none of them read the truth file.
How I checked it
- Every method is scored over 200 replicate portfolios rather than one lucky seed. Coverage that came back below 95% is reported as such instead of being tuned away.
Where it came from
I send drips and a newsletter for my real estate business and wanted to know what actually causes a booked call. Read the AI CRM case study.
Stack
Python, numpy, scipy, pandas, matplotlib, DuckDB, pytest
More screens