Pipeline and Forecast Cockpit
Synthetic benchmark Synthetic data: Ledgerly
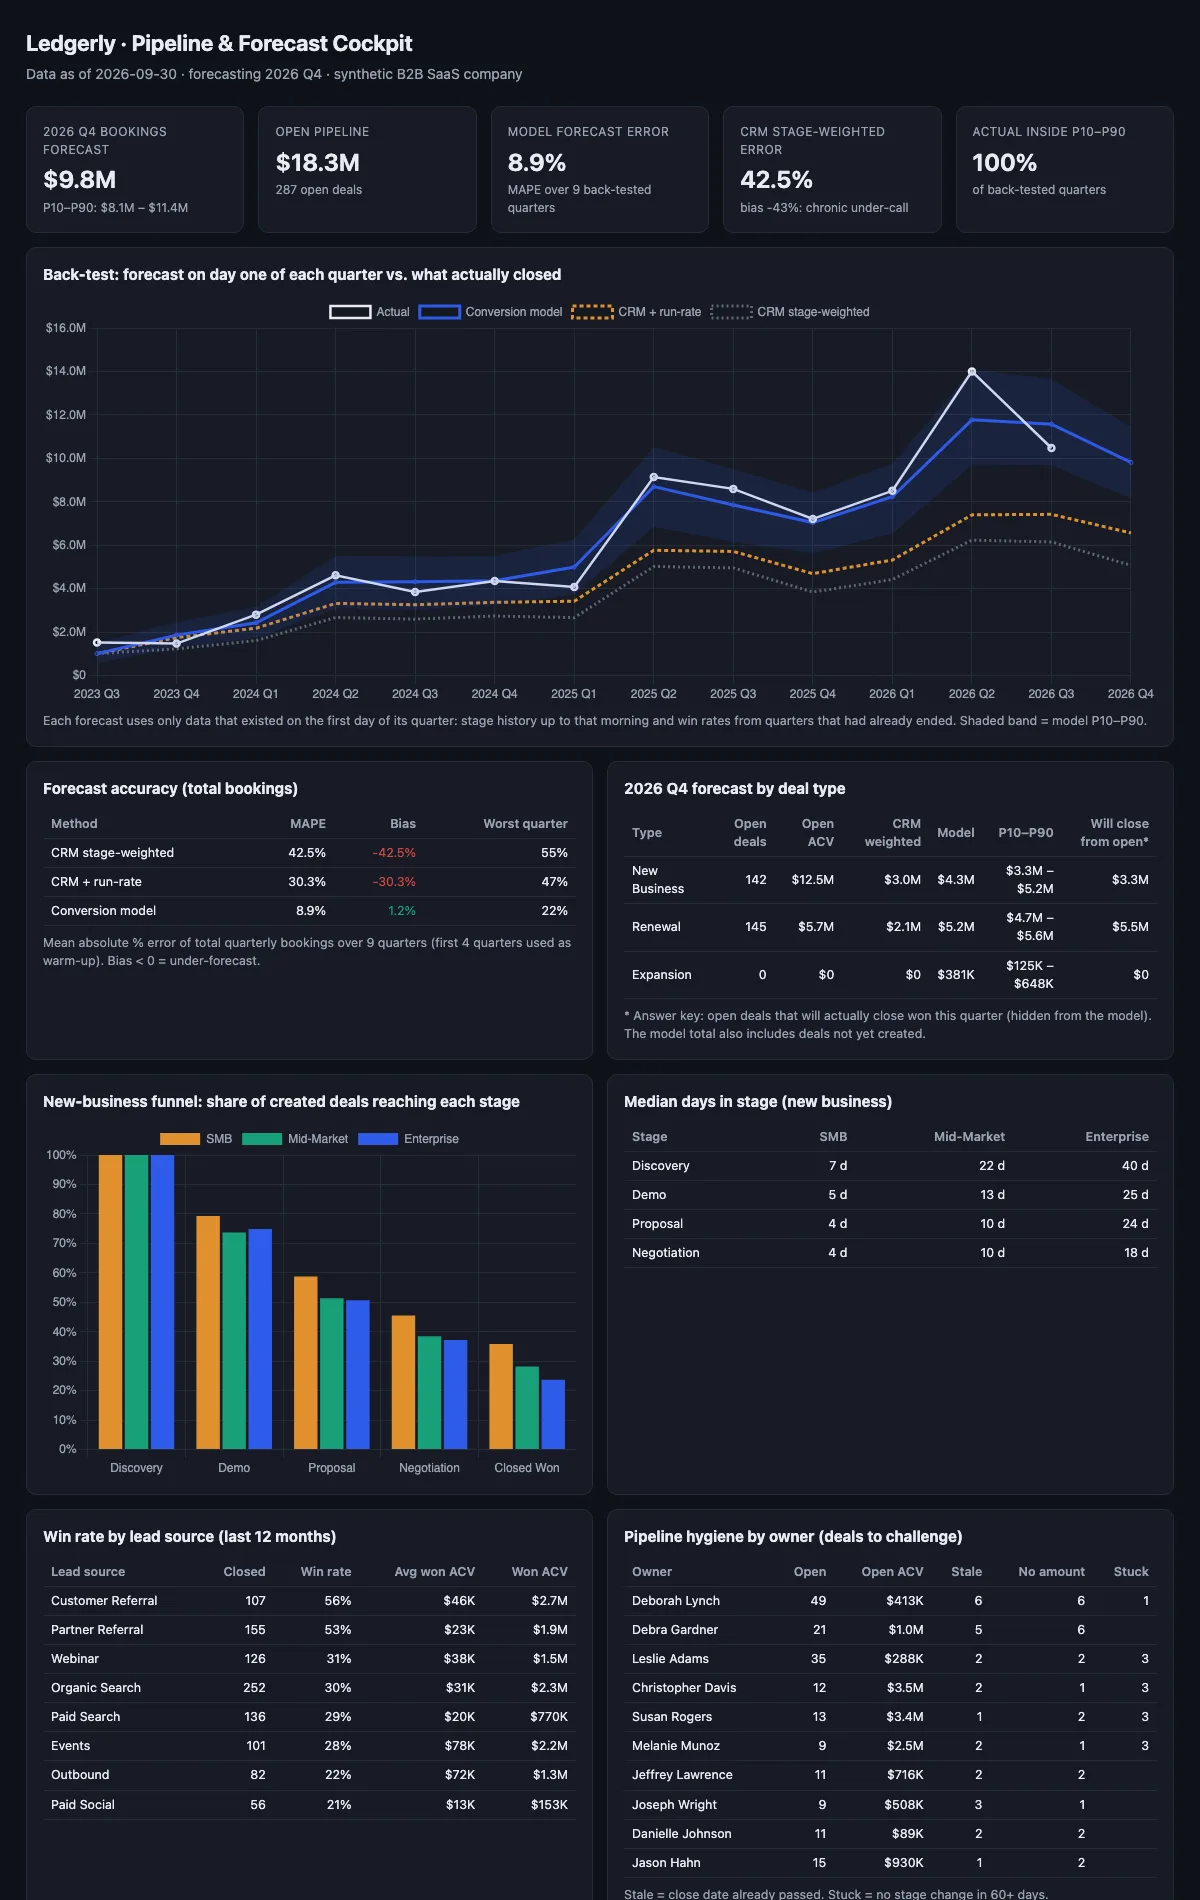
Pipeline analytics plus a quarterly bookings forecast that is back-tested honestly: for every past quarter it rebuilds the pipeline as it looked on day one, forecasts, and compares with what actually closed.
- Status
- Code on GitHub
- Relevant to
- Data and analytics, GTM Systems
Results · Synthetic data: Ledgerly
- Synthetic benchmarkSynthetic data: Ledgerly. Measured against a hidden answer key in that data. It shows the method works there, not a production result.forecast error (MAPE) over 9 quarters, against 42.5% for CRM stage-weightingSynthetic benchmark
- Synthetic benchmarkSynthetic data: Ledgerly. Measured against a hidden answer key in that data. It shows the method works there, not a production result.MAPE on a second company never used while building the modelSynthetic benchmark
- Synthetic benchmarkSynthetic data: Ledgerly. Measured against a hidden answer key in that data. It shows the method works there, not a production result.Q4 2026 forecast, P10–P90 $8.1M–$11.4MSynthetic benchmark
At a glance
- Question
- How much will close this quarter, and how far off is the usual CRM forecast?
- Data
- Ledgerly’s synthetic pipeline, plus a second synthetic company held back until the model was finished.
- Compared with
- CRM stage-weighting: each open deal’s amount times a generic stage percentage.
- How it was tested
- For each of 9 past quarters, rebuild the pipeline as it looked on day one, forecast, and compare with what actually closed. Rates are learned only from quarters that had already ended.
- Result
- Mean absolute error of 8.9% against 42.5% for stage-weighting, and 8.1% on the held-out company.
- What it doesn’t show
- Both companies come from the same simulator, so the size of the gap describes this data. It shows the method on a known answer key, not its accuracy on a real pipeline.
The problem
On Ledgerly’s synthetic pipeline, CRM stage-weighting under-called bookings by 42.5% on average across 9 back-tested quarters. In this data, stage percentages are generic, many SMB deals are created and won within the quarter, and 30% of Discovery deals have no amount.
What I built, in detail
- A conversion model with win-this-quarter rates by deal type, segment, stage and age, plus in-quarter run-rate and 4,000 simulations for a P10–P90 band.
- No future data: a deal’s stage comes from its last stage change before the quarter started, and rates are learned only from quarters that had already ended. A test checks both.
- Thin Enterprise segments are shrunk toward the stage average, and missing amounts are imputed instead of counted as $0.
- A single-file dashboard: funnel, velocity, win rate by source and a pipeline-hygiene list by owner.
Stack
DuckDB SQL, Python, pandas, numpy, Chart.js, pytest, GitHub Actions