Weekly Business Review Pack
Synthetic benchmark Synthetic data: Ledgerly
A generator for the weekly metrics review a SaaS leadership team runs on. Every number is defined once in a metrics registry and recomputed a second way before it is shown, and the quarter forecast comes with back-tested error bars.
- Status
- Write-up ready, code not public yet
- Relevant to
- Data and analytics, AI and agents
Results · Synthetic data: Ledgerly
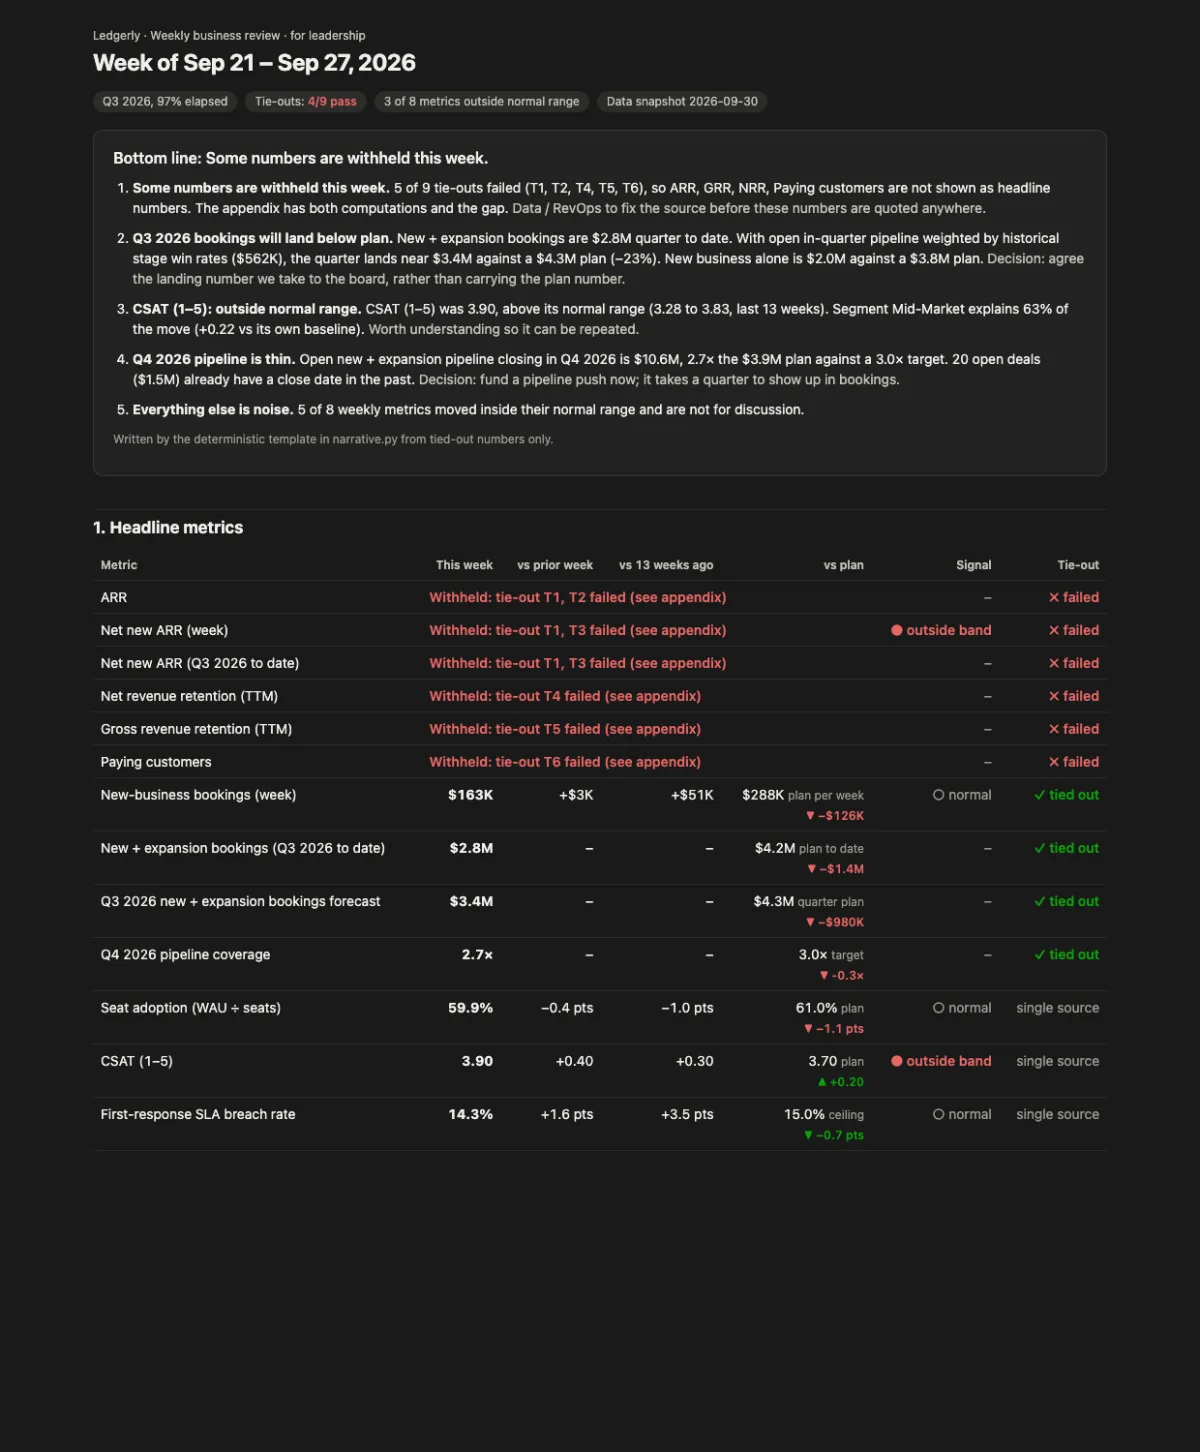
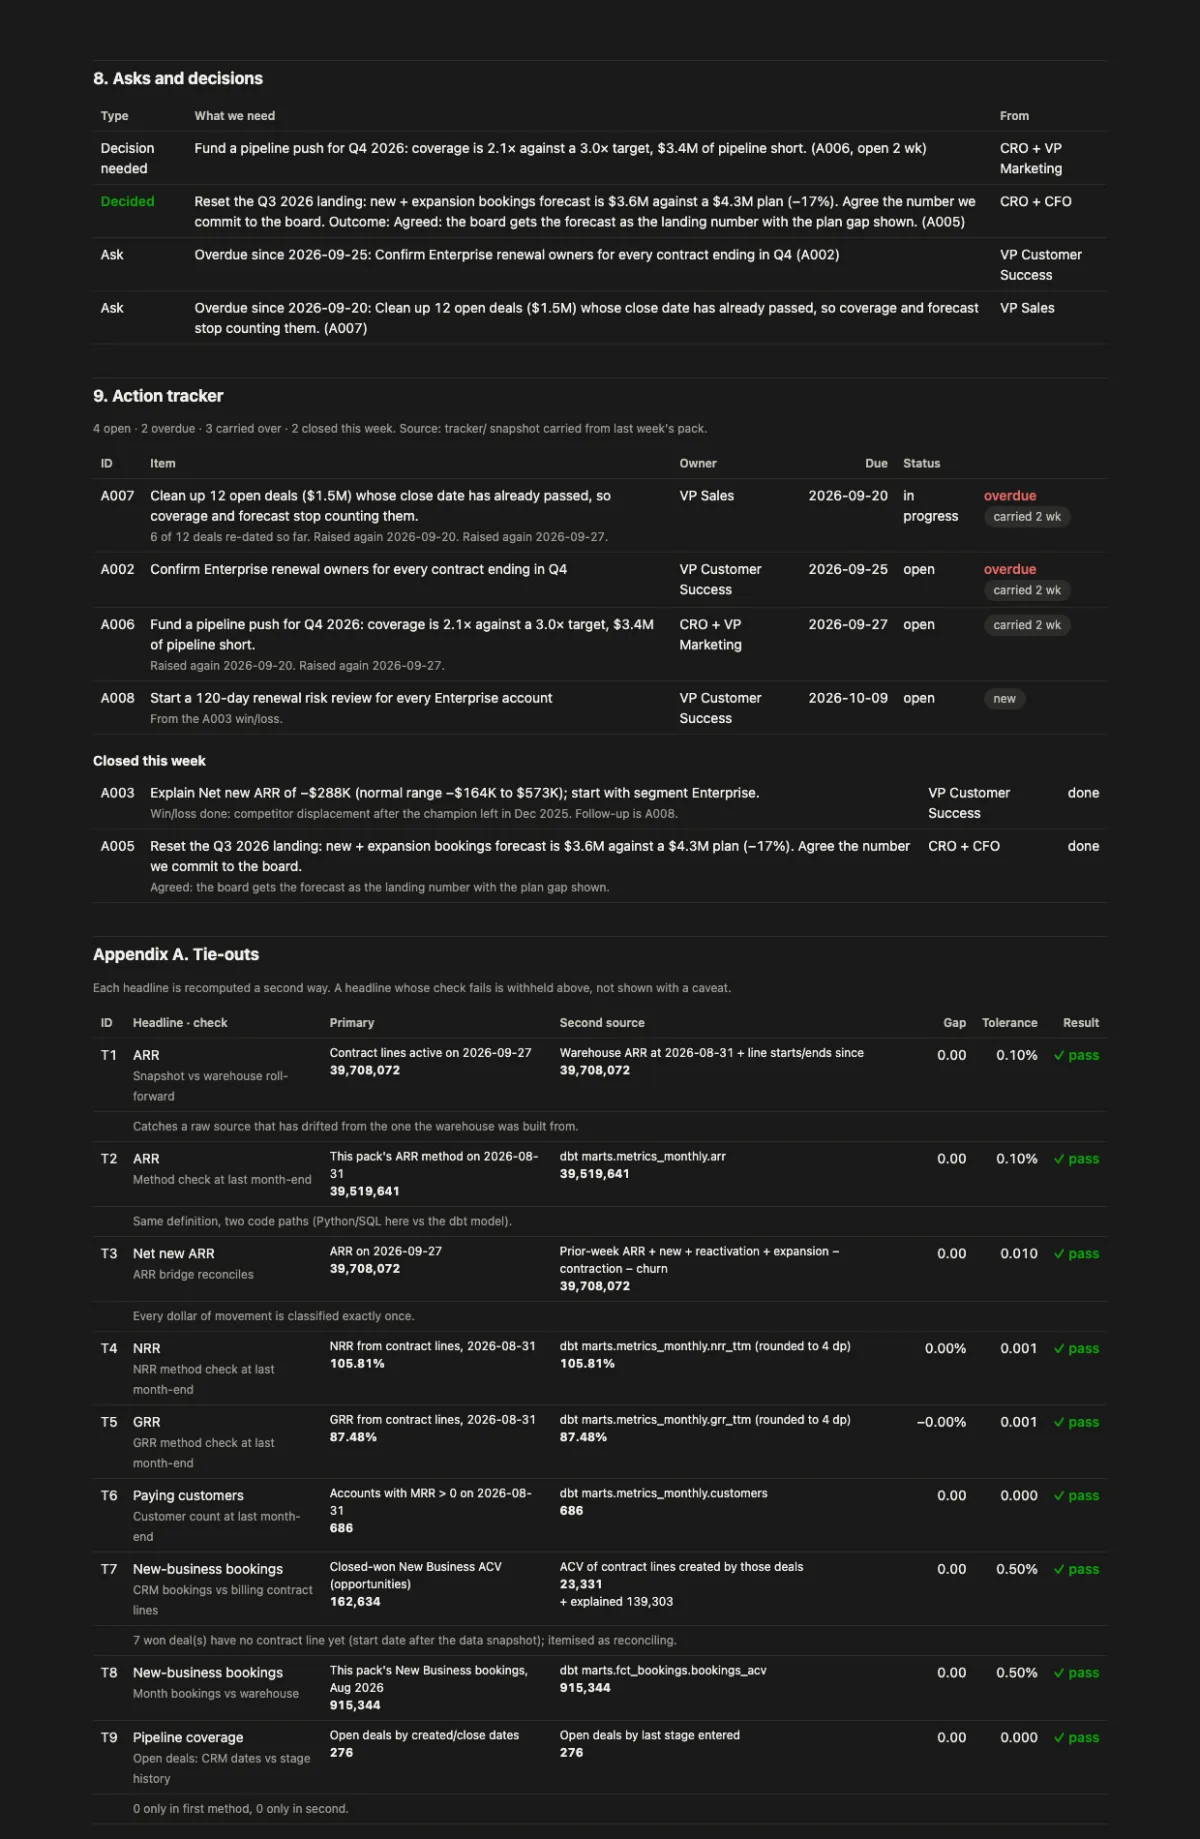
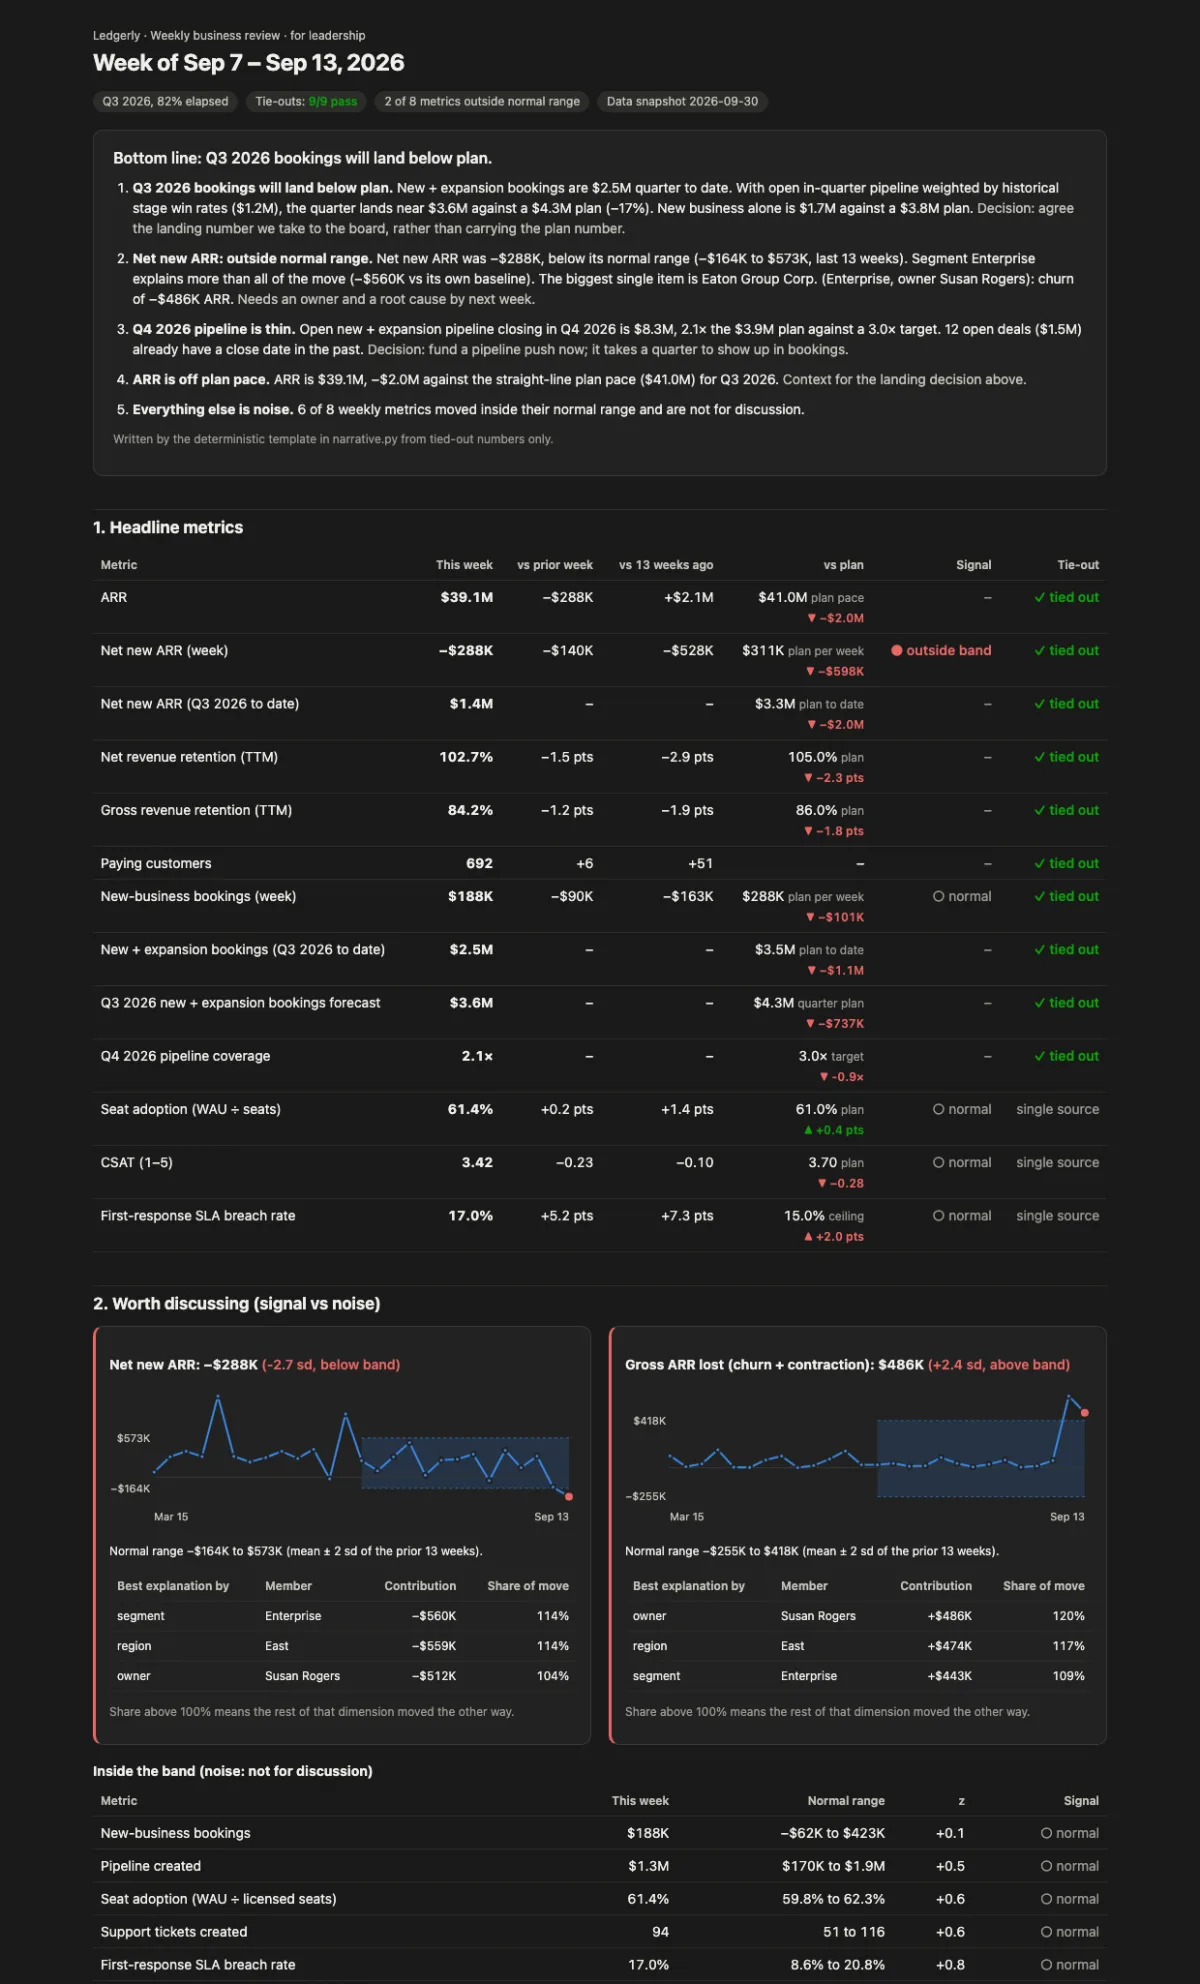
- Synthetic benchmarkSynthetic data: Ledgerly. Measured against a hidden answer key in that data. It shows the method works there, not a production result.tie-outs passing in all three weekly packsSynthetic benchmark
- Synthetic benchmarkSynthetic data: Ledgerly. Measured against a hidden answer key in that data. It shows the method works there, not a production result.ARR gap the tie-outs caught when the pack read a stale exportSynthetic benchmark
- Synthetic benchmarkSynthetic data: Ledgerly. Measured against a hidden answer key in that data. It shows the method works there, not a production result.mean forecast error over 117 back-tested forecasts, against 21.4% for stage-weightingSynthetic benchmark
- Synthetic benchmarkSynthetic data: Ledgerly. Measured against a hidden answer key in that data. It shows the method works there, not a production result.in the latest year by the seasonal bands, with no notable week lostSynthetic benchmark
At a glance
- Question
- What changed this week, is it more than normal noise, and does every headline number tie out?
- Data
- Ledgerly’s synthetic business for the last three full weeks of Q3 2026.
- Compared with
- Stage-weighting for the quarter forecast.
- How it was tested
- Nine tie-outs against second sources, and a quarter forecast back-tested every Sunday of 9 quarters.
- Result
- 9/9 tie-outs pass in each pack. Over 117 back-tested forecasts, mean error was 15.6% against 21.4% for stage-weighting.
- What it doesn’t show
- Synthetic data. Where the new forecast did worse than the old one, the write-up says so.
The problem
An executive review has to say what changed and why, separate a real move from normal noise, and never show a headline that doesn’t tie out.
What I built, in detail
- Packs for the last three full weeks of Q3 2026, each as self-contained HTML and a PDF.
- Seasonality-aware bands, so a month-end churn spike isn’t treated as news, and a driver search that names the segment, region or owner behind a move.
- A time-aware quarter forecast with P10–P90 error bars, back-tested every Sunday of 9 quarters.
- Nine tie-outs, each against a second source. If a check behind a headline fails, the headline is withheld, not footnoted.
- An optional memo drafted by Claude that is rejected if it contains any number not in the pack’s fact sheet.
How I checked it
- Definitions are reused, not re-invented: tests check that the pack’s ARR, NRR and GRR equal the dbt marts at every month-end.
- The bands were back-tested against weeks that were truly notable, defined from record-level data rather than from either band.
- Where the new forecast did worse than the old one, the write-up says so.
Where it came from
My CRM’s rule that a count always equals the rows behind it, turned into an executive pack. Read the AI CRM case study.
Stack
Python, DuckDB, pandas, Inline SVG, Headless Chrome, pytest, Anthropic SDK
More screens